-
Templates
1099 FormsAccurately report 1099 information returns and ensure IRS filing with easeExplore all templatesW-9 W-8 FormsEasily manage and share taxpayer details to streamline payments and meet IRS requirements with confidenceExplore all templatesOther Tax FormsFillable tax forms simplify and speed up your tax filing process and aid with recordkeeping.Explore all templatesReal EstateReal estate templates for all cases, from sale to rentals, save you a lot of time and effort.Explore all templatesLogisticsSimplify your trucking and logistics paperwork with our ready-to-use transportation and freight templates.Explore all templatesMedicalMedical forms help you keep patient documentation organized and secure.Explore all templatesBill of SaleBill of Sale templates streamline the transfer of ownership with clarity and protection.Explore all templatesContractsVarious contract templates ensure efficient and clear legal transactions.Explore all templatesEducationEducational forms and templates enhance the learning experience and student management.Explore all templates
-
Features
FeaturesAI-Enhanced Document Solutions for Contractor-Client Success and IRS ComplianceExplore all featuresAI Summarizer Check out the featureAI PDF summarizer makes your document workflow even faster. Ask AI to summarize PDF, assist you with tax forms, complete assignments, and more using just one tool.Sign PDF Check out the featurePDFLiner gives the opportunity to sign documents online, save them, send at once by email or print. Register now, upload your document and e-sign it onlineFill Out PDF Check out the featurePDFLiner provides different tools for filling in PDF forms. All you need is to register, upload the necessary document and start filling it out.Draw on a PDF Check out the featureDraw lines, circles, and other drawings on PDF using tools of PDFLiner online. Streamline your document editing process, speeding up your productivity
- Solutions
- Features
- Blog
- Support
- Pricing
- Log in
- Sign Up


Logarithmic Graph Paper
Get your Logarithmic Graph Paper in 3 easy steps
-
01 Fill and edit template
![Fill Logarithmic Graph Paper]()
-
02 Sign it online
![Sign Logarithmic Graph Paper]()
-
03 Export or print immediately
![Export Logarithmic Graph Paper]()
What Is a Logarithmic Graphing Paper?
Logarithmic graph paper, or semi-log graph paper, is a specialized type of graph paper used for applications involving exponential data. Instead of having lines that are evenly spaced out, the lines on this kind of paper are spaced in a way to represent a logarithmic scale. This makes it invaluable when dealing with data that increases or decreases exponentially. This tool becomes unavoidable and indispensable if you are working with such data.
Graph paper logarithmic explained
The graphing paper for logarithmic, unlike linear graph paper, which has equally spaced gridlines, has gridlines that are spaced in a particular way such that the lines get closer to each other as you move toward the right or top. Here, instead of a unit moving at a constant amount for each grid, it increases by multiples. It's particularly useful for plotting exponential growth or decay and for visually interpreting the rate of change in a graph.
How to Use Logarithmic Graph Paper
To start with, you need a logarithmic graphing paper. You can create one yourself or use a ready-made logarithmic graph paper template online. Remember to stick to the scale assigned on the paper and let each division represent a particular value. Then, plot your points on the graph accurately.
How to read logarithmic graphing paper
While regular graph paper works well for linear data, this one is designed for exponential data. To read it, start by identifying the axis. The x-axis typically represents the base number, while the y-axis represents the exponent. Each box on the y-axis corresponds to a numerical change in the exponent, not a proportional change. Understanding this simple rule is key to navigating logarithmic graph paper PDF.
Filling Out Logarithmic Graph Paper PDF
Understanding how to fill out this printable logarithmic graph paper follows the same procedure as using the paper mentioned earlier. You need to follow the logarithmic scale to plot data accurately. Incorrect placement of points can lead to inaccurate representation and analysis. This graphing paper is an essential tool for demonstrating data patterns that may not be as easily discernible on other types of paper. Remember, the logarithmic graph paper downloads for free on the PDFLiner website.
Using logarithmic graph paper correctly
Using logarithmic graphing paper properly ensures you get accurate and efficient results. The spaces between the lines denote orders of magnitude rather than conventional linear measurements. This means each equidistant line represents different orders of magnitude. So, ensure your data plot respects the logarithmic scale.
Where you can use the logarithmic graphing paper
The usage of logarithmic graphing paper extends to various scientific and mathematical fields. Here are a few instances where this form could be very handy:
- Physics students often utilize it in laboratory experiments for plotting data that changes exponentially. This could include anything from radioactive decay to sound intensity.
- In the field of finance and business, it can be employed to visualize growth rates, financial data, market trends and economic charts.
- Biologists use it while studying population growth or bacterial cultivation, as these follow exponential growth models.
- A field such as audio engineering sometimes requires the representation of varying sound levels in decibels, for which logarithmic graphing paper is used.
- It is an important tool for mathematicians to represent exponential functions or logarithms.
Related Content - Logarithmic Graph Paper
-
![]() Brag Sheet TemplateWhat Is Brag Sheet Template A Brag Sheet is a student questionnaire specifically designed to gather information for a counselor's letter of recommendation. It serves as a self-assessment tool where students can highlight their achievements,...
Brag Sheet TemplateWhat Is Brag Sheet Template A Brag Sheet is a student questionnaire specifically designed to gather information for a counselor's letter of recommendation. It serves as a self-assessment tool where students can highlight their achievements,... -
![]() State of Connecticut, Educational Employer VerificationCT I9 Form: Understanding and Requirements The CT I9 form is a federal requirement under the Immigration Reform and Control Act. It verifies an employee's identity and their authorization to work in the United States....
State of Connecticut, Educational Employer VerificationCT I9 Form: Understanding and Requirements The CT I9 form is a federal requirement under the Immigration Reform and Control Act. It verifies an employee's identity and their authorization to work in the United States.... -
![]() Biography Book Report TemplateWhat Is a Biography Book Report? A biography book report template is a structured format designed for effectively reviewing a biography. It includes sections where the student can write about the person's life, achievements, and...
Biography Book Report TemplateWhat Is a Biography Book Report? A biography book report template is a structured format designed for effectively reviewing a biography. It includes sections where the student can write about the person's life, achievements, and... -
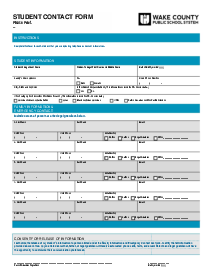
![]() Student Contact FormEmergency Contact Form for Students - A Vital Tool Every student's safety becomes the responsibility of an institution once they set foot there. One vital tool to ensure this is the student contact information form....
Student Contact FormEmergency Contact Form for Students - A Vital Tool Every student's safety becomes the responsibility of an institution once they set foot there. One vital tool to ensure this is the student contact information form.... -
![]() Equipment Release FormWhat Is an Equipment Release form? The fillable Equipment Release form is an agreement between two parties about the liability over the equipment. After one party downloads the Equipment Release form, it is filled with...
Equipment Release FormWhat Is an Equipment Release form? The fillable Equipment Release form is an agreement between two parties about the liability over the equipment. After one party downloads the Equipment Release form, it is filled with...


Fillable online Logarithmic Graph Paper