-
Templates
Tax FormsFillable tax forms simplify and speed up your tax filing process and aid with recordkeeping.Explore all templatesReal EstateReal estate templates for all cases, from sale to rentals, save you a lot of time and effort.Explore all templatesInsuranceInsurance templates make it easier for agents to manage policies and claims.Explore all templatesLegalLegal templates provide a structured foundation for creating legally binding documents.Explore all templatesMedicalMedical forms help you keep patient documentation organized and secure.Explore all templatesBill of SaleBill of Sale templates streamline the transfer of ownership with clarity and protection.Explore all templatesContractsVarious contract templates ensure efficient and clear legal transactions.Explore all templatesEducationEducational forms and templates enhance the learning experience and student management.Explore all templates
-
Features
FeaturesThe all-in-one document management system has all the features you need to safely and efficiently handle your PDFs. Dive in, learn how to use all the tools, and become a PDF pro.Explore all featuresShare PDF Check out the featureWith the help of PDFliner you can share your PDF files by email or via the link as soon as you have edited, filled, or signed them online.Sign PDF Check out the featurePDFLiner gives the opportunity to sign documents online, save them, send at once by email or print. Register now, upload your document and e-sign it onlineFill Out PDF Check out the featurePDFLiner provides different tools for filling in PDF forms. All you need is to register, upload the necessary document and start filling it out.Draw on a PDF Check out the featureDraw lines, circles, and other drawings on PDF using tools of PDFLiner online. Streamline your document editing process, speeding up your productivity
- Solutions
- Features
- Blog
- Support
- Pricing
- Log in
- Sign Up


Coordinate Graph Paper
Get your Coordinate Graph Paper in 3 easy steps
-
01 Fill and edit template
![]()
-
02 Sign it online
![]()
-
03 Export or print immediately
![]()
What Is Coordinate Graph Paper PDF?
The polar coordinate graphing paper form serves numerous practical purposes, which include geometry assignments, creating bar graphs, or planning design projects. What makes this form unique is that it comes equipped with an intricate grid system to make your graphical representation easy yet precise.
Features of a coordinate graph paper
The graph paper with coordinates stands out from regular papers due to its distinct characteristics. It comes with horizontal and vertical lines, creating a grid pattern over the entire sheet. Each intersecting point, defined by the intersection of these lines, signifies a specific point on the graph as per the x and y coordinates. The readability of graphs couldn't be better on any other paper, making your graph paper a preferred choice for graphing routines.
How to Fill Out Coordinate Graph Paper
Confused about how to fill out a printable coordinate graph paper form? Have no worries. It’s a straightforward exercise. Utilizing online graphing paper with coordinates allows for practical application and easy data interpretation. Here’s how:
- Determine the coordinates: The first step in filling out a graph form is determining the coordinates you wish to plot.
- Locate the coordinates: Once the coordinates are established, identify their location on the grid.
- Plot the points: Mark these points as a small x or dot at the correct position on the graph.
- Connect the plots: If required, you can connect these dots using a straight line or lines to underline the relationship between the data points.
Aspects of polar coordinate graph paper
A polar coordinate graphing paper stands out due to its circular pattern instead of the typical square grids. It comprises concentric circles divided equally by lines or rays stemming from the center. The positioning of plotted points is determined by the angle and distance from the central point, known as the pole. This design is particularly useful for applications like plotting trigonometric functions or representing complex number equations.
Related Content - Coordinate Graph Paper
-
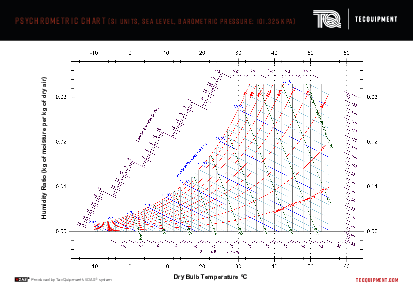
![]() Psychrometric ChartWhat Is a Psychrometric Chart? A Psychrometric chart, for the uninitiated, is a vital tool used extensively in the heating, ventilation, and air conditioning (HVAC) industry. It provides a graphic representation of various air properties...
Psychrometric ChartWhat Is a Psychrometric Chart? A Psychrometric chart, for the uninitiated, is a vital tool used extensively in the heating, ventilation, and air conditioning (HVAC) industry. It provides a graphic representation of various air properties... -
![]() Chain of Custody FormWhat Is the Chain of Custody Form? The Chain of Custody Form is used for the confirmation that a specimen was handled in the right way during the drug testing. There are federally mandated chain...
Chain of Custody FormWhat Is the Chain of Custody Form? The Chain of Custody Form is used for the confirmation that a specimen was handled in the right way during the drug testing. There are federally mandated chain... -
![]() GNDU Migration CertificateWhat Is a GNDU Migration Certificate Form? It is a three-page document that every Guru Nanak Dev University student can use to request the migration certificate needed to continue their studies. This file is filled...
GNDU Migration CertificateWhat Is a GNDU Migration Certificate Form? It is a three-page document that every Guru Nanak Dev University student can use to request the migration certificate needed to continue their studies. This file is filled... -
![]() Scholarship Application FormWhat Is a Scholarship Application Form? A scholarship application form is a document you submit to request financial aid based on your qualifications, achievements, or needs. This form usually includes fields to record your personal...
Scholarship Application FormWhat Is a Scholarship Application Form? A scholarship application form is a document you submit to request financial aid based on your qualifications, achievements, or needs. This form usually includes fields to record your personal... -
![]() Character MapWhat Is a Character Map? A blank character map is a visual or written tool that helps writers or filmmakers develop and organize the various aspects of their fictional characters. It serves as a reference...
Character MapWhat Is a Character Map? A blank character map is a visual or written tool that helps writers or filmmakers develop and organize the various aspects of their fictional characters. It serves as a reference...


Fillable online Coordinate Graph Paper